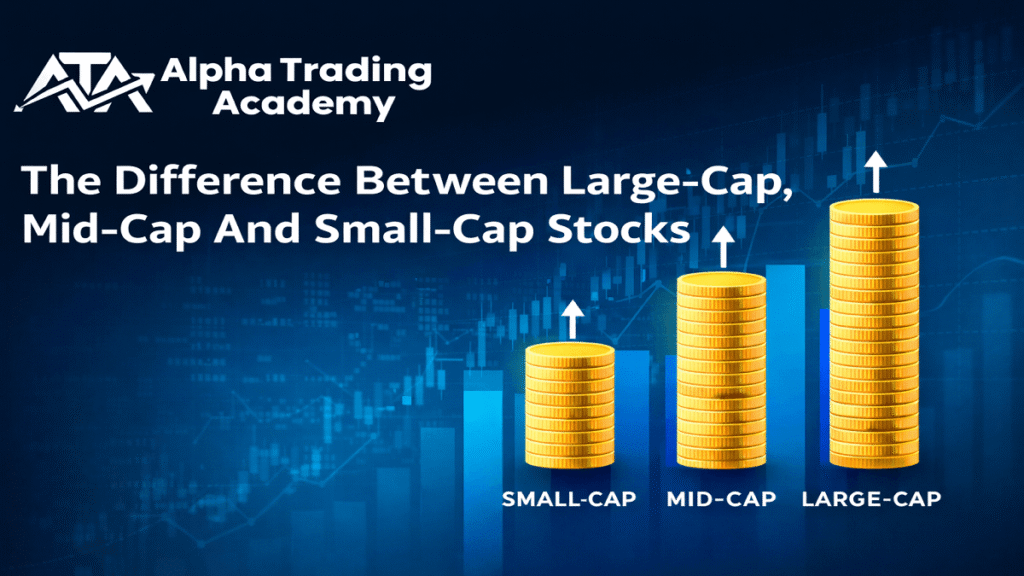
What is Algorithmic Trading and How Can It Make You a Better Trader?
Have you ever wondered how some traders react faster than lightning when markets move? Before you even click buy they’ve already made the profit and exited. That’s not superhuman speed, that’s Algorithmic Trading also prominently known as algo trading. In today’s stock market more than 70% of the global trades are made by algorithms not humans. Even in India algo trading is growing fast among brokers, hedge funds and even retail traders.
What is algorithmic trading?
Algorithmic gradients using computer primer algorithms trades automatically in the stock market. Instead of just sitting in front of a screen deciding when to buy or sell a software program does it for you based on a set of predefined rules. In simple terms you tell your computer if stock rises above 500 these and volume double s buy 100 shares. The algorithm basically waits watches the market and when those conditions are met boom it executes the trade automatically. No hesitation, no emotion , no delay.
These rules can be based on:
- Price
- Time
- Volume
- Technical indicators
- Or even complex mathematical models
Why Does Algorithmic Trading Exist?
Trading is all about timing and precision. But humans also have some limitations
- We get emotional.
- We react slowly.
- We can’t monitor hundreds of stocks at once.
Computers on the other hand don’t get tired or scared; they execute instantly to trade faster, smarter and more consistently.
How does an Algorithmic trading strategy work?
Build a strategy
Firstly you need to define a strategy, a set of rules for buying and selling. For example when the 50 day moving average crosses above the 200 day moving average sell when RSI goes above 70. This becomes the logic behind your trading algorithm.
Back test the strategy
Next the algorithm is tested on the historical data meaning how it would have performed in the past. This helps you see if your rules actually work before risking the real money if the results look promising the algorithm is fine-tuned for better accuracy.
Execute Trades Automatically
Once the algorithm is live it:
- Scans markets continuously
- Detects matching signals
- Places orders automatically
- Manages risk (through stop-loss or target rules)
Who uses algorithmic trading?
| User Type | Purpose |
| Institutional Investors | To execute large orders without affecting prices |
| Hedge Funds | To exploit small, short-term opportunities |
| Brokers | To provide liquidity and faster execution |
| Retail Traders | To automate their strategies and avoid emotion |
At first the trading was used mainly by big players, investment banks, hedge funds and institutional investors. But now thanks to technology and online trading platforms even retail traders can access it instantly.
Types of algorithmic trading strategies
Trend following strategies
These are the most popular; they follow indicators like moving averages, breakouts or momentum. You actually buy when the stock price crosses above the 50 day moving average and sell it when it crosses below. Simple logic and often effective.
Arbitrage strategies
This takes advantage of price differences between two exchanges or markets humans cannot do it quickly but algorithms can in milliseconds.
Mean reversion strategies
This assumes that the price tends to return to the average width time. For example if a stock usually trades around ₹200 but suddenly drops to ₹190.00 algorithm might by expecting it to move back towards ₹200.
Market making strategies
It is basically used by brokers or high frequency traders. The algorithm places buy and sell orders around the current market price to earn small profits from the difference. For example you can buy ₹100 then select 100.10 hundreds of times a day.
Scalping algorithms
Super short term strategy that makes dozens or hundreds of trades per day for tiny profits. It’s all about volume and speed, not holding positions for too long.
Benefits of algorithmic trading
Algorithms react in milliseconds faster than any human can that gives you an edge in the fast moving markets. There is no fat finger mistake, the program executes exactly what your code does. No panic selling, no greed , no I’ll just hold just a little longer. Algorithms basically trade based on data not feelings. You can also test your strategy on years of market data before going live. Because algorithms execute effectively they can help you reduce brokerage and slippage costs.
The risks and challenges of algorithmic trading
If there is even one mistake in your code it could execute wrong traits and cause big losses. Sometimes the traders tune the algorithms to perform perfectly on past data but they fail in real markets. Power cuts, Internet dropouts or server issues can interrupt our execution.
How to start algorithmic trading?
Understanding the trading markets and risk management first is very important. Then you can learn how algorithms work. Many brokers in India now support algorithmic trading through APIs. The platforms make it very easy for you to create algorithms visually, no heavy coding required. Always start small, don’t jump into high frequency or complex strategies. Use historical market data to check if it worked in the past. Most platforms offer back testing features. If it performs well across different times, move ahead. Before using real money, test it in simulation mode. This will help you see how it reacts in real time without losing money once you’re confident deploy your algorithm in the live market, start small monitor performance and improve overtime.
Want to learn algorithmic trading?
If it all sounds exciting but technical don’t worry you can learn it step by step through structured courses at Alpha Trading. Even if you’re a beginner the program can help you understand the technology that drives modern markets.
The world of trading is changing and algorithms are leading the way. Whether you trade stocks forex or crypto automation gives you the edge that manual trading simply cannot match but remember algorithms don’t guarantee profits. This simply helps you trade smarter, faster and more consistently. Start small, learn constantly and build your strategy. And one day you will look back and realize you didn’t just become a trader you became a systematic one.
Fundamental Analysis in Stock Market
Have you ever wondered how some investors seemed to pick the right stocks, the ones that grow steadily and give returns over the years? Do they have secret insider information but not really what they do have is something powerful: Fundamental Analysis in the Stock Market. If you’re a serious long term investor or want to understand how to find strong companies to invest in, fundamental analysis is very important.
What is fundamental analysis?
Fundamental analysis is basically the process of studying a company’s financial health performance and potential to understand whether its stock is worth buying or not. In simple terms it’s not just about finding the real value of a company, not just the market price. Think of it like this: you are shopping for a phone, you don’t just buy the one that looks shiny, you check the features, battery life and performance before deciding if it’s worth the price. That’s exactly what investors do with the companies through fundamental analysis.
The Core Idea Behind Fundamental Analysis
Every company has two values:
- Market Value (Price): What people are willing to pay for its stock right now.
- Intrinsic Value (True Worth): what the company is actually worth based on its performance and assets.
If a stocks market rises below their intrinsic value it’s considered undervalued and that’s often a good buying opportunity. If it’s overvalued it might be time to avoid it or even sell it. That’s the goal of fundamental analysis. We have to find undervalued gems before the crowd notices them.
Why does fundamental analysis matter?
In a world full of tips and short term trading noise fundamental analysis gives you clarity and confidence. It helps you invest with logic not emotion. You base our decisions on facts not type. You identify long term winners. It reduces risk when you understand a company’s business and financials you are least likely to panic during short term market swings. You become an independent thinker and you no longer rely on market experts or even social media tips.
Types of Fundamental Analysis
The top down approach is where you start by looking at the bigger picture: the economy, the interest rates and government policies. Then you narrow down to sectors and companies that will benefit most.
Bottom down approach is where you start with two individual companies studying their performance management potential regardless of the broader economy.
Steps to do fundamental analysis
Understand the economy like what the company does, how it makes money and who the customers are. You can find this in the company’s annual report website or Stock Exchange filings. If you are analyzing HDFC Bank you would study how it earns money from its customer base and then compare it to SBI or any other bank.
Study the financial statements like profit and loss balance sheet and cash flow statement. Always prefer companies that generate consistent cash flow and have manageable debt.
Analyze key financial ratio
| Ratio Name | Formula | Tells You About |
| P/E Ratio (Price-to-Earnings) | Market Price / Earnings per Share | Whether the stock is over or underpriced |
| P/B Ratio (Price-to-Book) | Market Price / Book Value | If the market price is fair compared to assets |
| ROE (Return on Equity) | Net Profit / Shareholders’ Equity | How efficiently the company uses its money |
| Debt-to-Equity | Total Debt / Shareholders’ Equity | How much debt the company has |
| EPS (Earnings per Share) | Net Profit / No. of Shares | Company’s profitability per share |
| Dividend Yield | Dividend per Share / Market Price | How much return you get from dividends |
Study the industry and competitors
No company exists in isolation. The success basically depends on the market it operates in. You need to look at the market size and growth rate, competition and government policies.
Evaluate management quality
A company’s management can make or break its success, to look for experienced and ethical leadership transparency and communication and consistent business vision. You can also check management interviews, annual reports or even shareholder meeting summaries.
Identify Growth potential
You need to ask if the company has room to grow or is it entering new markets or launching new products. Companies that reinvest profits smartly tend to grow steadily.
Find the intrinsic value
This is where you actually estimate what the company is really worth. There are several methods but Simply put intrinsic value equals to present value of future earnings. If the current market price is less than intrinsic value it’s undervalued it’s a good buy instead of the price is more than intrinsic value it’s overvalued avoid or wait.
Example of Fundamental Analysis in Stock Market
| Aspect | Observation |
| Business | IT services, global clients, recurring revenue |
| Revenue Growth | Steady 10–12% per year |
| Profit Margin | Around 20% — strong |
| Debt | Very low |
| Cash Flow | Positive and consistent |
| Management | Experienced, transparent |
| Industry Outlook | Growing demand for IT & AI services |
Advantages of fundamental analysis
It helps you invest, not gamble. You just focus on growth, not short term price moves. By understanding financials you avoid poor quality or low valued companies. You don’t panic during market dips because you know your company’s strength. You can actually find undervalued stocks before they become popular.
Limitations of fundamental analysis
No method is basically perfect. Fundamental analysis actually has some challenges. You need to read reports, study numbers and stay updated. It’s ideal for long term investors not intraday traders.
Learn fundamental analysis the smart way
If you’re serious about investing and want to learn properly consider joining a stock market training course at Alpha Trading. Here you can learn how to read financial statements, understand ratios and analyze sectors. Learning from professionals gives you confidence and helps you make independent decisions.
So at its heart fundamental analysis is not just about understanding the story behind the stock, it’s all about watching its price move up or down. It teaches you to invest in business, not just stocks.
How to Start Trading in the Stock Market as a Student?
If you are a student and curious about the stock market you are ahead of the game. No doubt most people your age might be busy scrolling Social media. You are learning how to make your own money grow and that’s a powerful mindset, the good news? You can Start learning and even trading in the stock market as a student but only if you do it the right way. In this guide you can learn everything about Stock Market Trading for Students.
Why should you start Trading as a Student?
Let’s be real, school and college rarely teach you how money actually works. You might know physics and algebra but when it comes to investing or trading you have to start from zero. Learning about the stock market changes that. You’ll learn how to grow money not just earn it instead of keeping money ideal you learn how to make it work for you. You build financial discipline like investing regularly teaches you patience and planning. You get more time to learn because you are starting young. You can afford mistakes and learn from them early.
You develop analytical thinking, understanding the market improves your decision making and logical reasoning. It can become a future career as many professional traders and analysts started experimenting as students. So even if you don’t know much about money right now you can Start learning and preparing and that’s more valuable than rushing blindly.
Understanding Share market basics for students
Before jumping in Smart strategies for student traders in India, you need to understand the basics. Trading simply means buying and selling financial investments like shares, mutual funds, or currencies usually for short term profits. For example when you buy a share or own a small part of the company if the company performs well and its stock prices rises your investment grows. There are mainly two types of approaches to the stock market. Investing buying it for the long term stop trading means buying and selling frequently to profit from short term price changes. As a student you can always learn both the concepts gradually starting by learning how investing works and then moving to trading once you are comfortable.
Step by step how to start trading as a student
learn the basics first
Before starting stock trading for students you need to understand how the stock market works. Start with some topics like shares and Stock Exchange. What is demat and trading account besides how to share prices move. You can easily learn all this for free like watching YouTube materials, reading blogs and joining student-friendly online stock market courses.
Open a demat and trading account
To buy or sell shares you need 2 accounts. Demat account stores yourself electronically and trading account lets you buy or sell shares on the exchange. You can open both with a broker. Usually you must be 18 years or even older to open these accounts. If you’re under 18 you can still open one with your parents’ healthy account in their name with you as a minor. Once done you are officially ready to trade.
Popular brokers for students:
- Zerodha (great for beginners)
- Groww (simple interface, app-based)
- Upstox
- Angel One
- ICICI Direct (for students with parent bank accounts)
Documents you’ll need:
- PAN card
- Aadhaar card
- Bank account
- Passport-size photo
Learn to read the market
Once your account is ready, spend more time observing rather than trading. You need to look at stock prices and how they move daily company news and quarterly results besides basic chart patterns. Don’t worry if it feels confusing at first everyone feels that way.
Starts small with virtual trading
This one is the smartest thing that you can do. Instead of just jumping in with real money you can use virtual reading apps called paper trading. These platforms let you practice trading using fake money but with real stock data.
Start real trading
Once you are prepared and practiced for a few months to understand the basics you can start small, really small. Even 500 to ₹1000 is enough to buy your first share. The goal is not to make big profits, it’s to learn how real trading works. Focus on blue chip or stable companies and avoid penny stocks.
Learn fundamental and technical analysis
Once you have started the real learning begins. Every good trader understands two types of analysis: fundamental analysis and technical analysis. Fundamental means studying the company’s performance revenue profit management and growth potential while technical analysis means studying the price charts and patterns to predict the future movements.
| Trading Style | Time Frame | Ideal For |
| Intraday Trading | Buy & sell in same day | Active traders |
| Swing Trading | Hold for a few days | Part-time traders |
| Positional Trading | Hold for weeks or months | Beginners |
| Long-Term Investing | Hold for years | Students & investors |
Keep learning
The stock market is a lifelong classroom. Even experienced traders learn something new every day. Make learning a habit, read finance blogs and watch market news.
Common mistakes to avoid
| Mistake | Better Way |
| Jumping into trading without learning | Practice on demo accounts first |
| Expecting quick profits | Focus on learning process |
| Ignoring stop-loss | Always protect your capital |
| Following tips blindly | Do your own analysis |
| Trading emotionally | Stay calm and disciplined |
| Not tracking results | Maintain a trading journal |
Courses and resources for student traders
If you want to learn trading the right way student structured courses are available. You can join experts at Alpha Trading and start trading classes. You can learn the basics of stock market trading and understand the risk and psychology.
So if you’re a student you have something most people don’t have time. And time is the most powerful asset investing. You don’t need a lot of money to start, you just need curiosity, patience and the will to learn.
The Ultimate Guide to Technical Analysis in Stock Market
Have you ever wondered how some traders seem to predict market movements even before they happen? They look at charts, draw lines, moving averages or something called MACD and somehow, they know when to buy or sell. That’s not magic, that’s called Technical Analysis in the Stock Market. Whether you’re a beginner or an active trader, understanding technical analysis can truly change the way you see the stock market.
What is Technical Analysis in the Stock Market?
Technical analysis is actually the art and science of predicting future movements by studying past price and volume data. And simple words all about reading charts and identifying patterns and how a stock behaves. Instead of focusing on what a company does, technical analysis basically focuses on how the stock market moves. For example, if a stock’s price has gone up every time it touched rupees 500 then 500 works like a support. If it keeps falling every time it hits ₹550, that’s resistance. If it breaks ₹550.00 with high volume that’s a bullish signal the stock might further rise.
Why does technical analysis matter?
If you want to trade successfully, timing is everything. Even the best company stock can give you losses if you buy it at the wrong time. That’s the only reason why you must consider learning about Best Technical Indicators & Tools for Trading. This will help you find the right entry and exit point and you will know when to enter an exit and when to take profits. Instead of guessing or following tips you rely on your signals. You can use it for different trading types like intraday swing or long-term trading. It works not just for stocks but also for forex crypto and commodities.
The core principles of technical analysis
market discounts everything
Every bit of information about company performance and global trends is already reflected in the stock price. So instead of reading thousands of reports you can analyze the price chart itself. It is like understanding Strategies for Different Types of Trading.
Price move in trends
Markets don’t move randomly; they move in trends upward, downward or sideways. Once a trend starts it’s likely to continue until a clear reversal happens.
History repeats itself
Human emotions don’t change. That’s why patterns from decades ago still repeat today and that’s why technical analysis helps you understand.
Technical analysis versus fundamental analysis
| Aspect | Technical Analysis | Fundamental Analysis |
| Focus | Price, volume, and market trends | Company’s financial health, earnings, and value |
| Time Horizon | Short-term to medium-term | Long-term |
| Tools Used | Charts, indicators, patterns | Balance sheet, P/E ratio, cash flow |
| Goal | Identify trading opportunities | Find undervalued companies |
| Who Uses It | Traders | Investors |
different types of technical charts
Line chart is the simplest form. It connects the closing prices of each day. It’s great for beginners. The bar chart shows open high low and close prices. Is just perfect for understanding volatility. Candlestick charts are most widely used. Candlestick shows open closing high and low prices in one visual. Green candle means price went up and red candle means price went down.
Common technical indicators you should know
Moving average smooths out the price data to show the direction of the trend. Simple moving average price over a set time. Exponential moving average gives more weight to recent prices. When the short-term average crosses above the long-term average it’s a bias. When it crosses below it’s a sell signal.
Relative strength index measures the speed and changes of the price movements. RSI above 70 means an overbought price might fall soon. RSI above 30 oversold prices might just rise anytime soon. The traders use RSI to identify entry and exit points.
Moving average convergence divergence shows the relationship between two moving averages. When this crosses above the signal line it is by signal when it crosses below it just sells signal. It helps confirm the strength and direction of a trend.
Bollinger bands consist of three lines, a moving average and two outer bands. When prices touch the upper hand, the stock might be overbought. When they touch the lower band, it might be oversold. They are a perfect element for spotting volatility and potential reversals.
The volume indicator truly tells you how strong the price move is. If the price rises with high volume the trend is strong. If it rises with low volume, it might not be lasting. Always look for volume confirmation before taking any positions.
Popular chart patterns every trader should know
Head and shoulders are a pattern that signals a trend reversal. The middle peak is higher than the two side peaks. Once the neckline breaks it’s time for you to sell.
Double top and double bottom. Double top appears after an uptrend in signals A reversal downward. Double top physically appears after a downtrend and signals upward reversal. The patterns help you basically spot turning points early.
Triangle patterns show price consolidation before a breakout when the price breaks out of the triangle with volume you can expect a strong move.
Flags and pennants are basically short-term continuation patterns that occur after a big price move. When the flag forms and the breakout happen it usually continues to the previous trend.
Learn technical analysis the right way
If you’re serious about mastering trading consider joining an online stock market course at Alpha Trading Academy. The experts can help you learn everything about how to read the charts like a pro how to combine indicators for accuracy. You can also learn everything about risk management and trading psychology and real-world trading setups.
So technical analysis is not just about guessing it’s all about reading the story behind price movements. Yes, it takes time to learn but once you master it becomes an edge in the market. It gives you confidence to trade logically not emotionally so start small open charts and learn indicators that forged the patterns. You can practice regularly and soon you will see the market through a completely different lens.